
Urban Planning

Net Emissions Impacts of Transit Operations — Utah Transit Authority, Wasatch Front

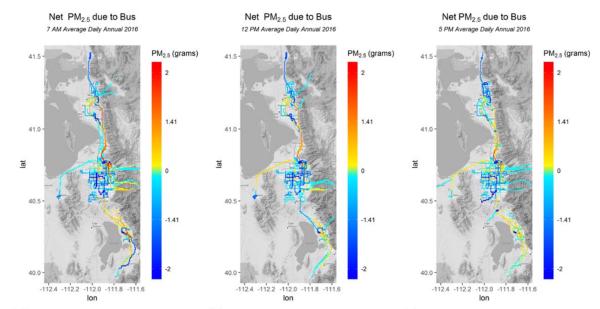
First study to model net VMT, fuel consumption, CO₂, and criteria air pollutant impacts of an entire US transit system at hourly and city-block spatial resolution, combining UTA’s electronic fare collection and automated passenger counter data with GTFS service schedules — finding that UTA collectively offsets ~1.5% of seven-county onroad emissions, with strong spatial and temporal heterogeneity by mode, time of day, and season.
Region
Wasatch Front, Utah (Salt Lake, Davis, Weber, Utah, and adjacent counties); Salt Lake Valley airshed
Sector
Academic
Methods
GTFS feed processing: route geometry construction, stop snapping, and trip segmentation in ArcGIS 10.3.1, Grid intersection of transit route segments with 0.002° × 0.002° (~200 m) atmospheric modeling grid, Electronic fare collection (EFC) trip processing and spatial allocation to GTFS routes, APC-based scaling of EFC ridership to system-wide passenger miles by mode, Transit vehicle emissions estimation using UTA Transit Emissions Quantifier Tool (APTA TEQ v10, Utah fleet–specific factors), Avoided auto emissions modeling (single-occupancy vehicle equivalents, EPA emission factors), Net emissions calculation: avoided minus realized, by mode, hour, grid cell, and pollutant species (CO₂, CO, NOx, PM2.5, SOx, NMHC), Fleet modernization sensitivity analysis (CNG/clean diesel buses, Tier 3 commuter rail locomotives)

SimHestia: Projected CO₂ Emissions from Future Land Use Change — Salt Lake Valley

Forward projection of building-sector fossil fuel CO₂ emissions under two 2040 growth scenarios for the Salt Lake Valley, translating EnvisionTomorrow+ regional planning data into parcel-scale building stock changes and reaggregating to the Hestia atmospheric modeling grid for direct comparison with the 2010/2011 baseline inventory.
Region
Wasatch Front, Utah, USA
Ecosystem
Urbanized intermountain basin; rapidly suburbanizing valley floor, Wasatch Front
Sector
Academic
Methods
ET+ (EnvisionTomorrow+) Development Type → BuildingType disaggregation for trend and compact 2040 growth scenarios, Building type crosswalk: ET+ regional planning typology → Hestia energy modeling building types, Parcel-scale building stock allocation via lot-size weighting (four-state accounting: 2010 baseline, demolition/redevelopment, new construction, 2040 total), Grid-cell reaggregation to 0.002° × 0.002° (~200 m) Hestia atmospheric modeling grid, Building energy use and FFCO₂ modeling by building type and vintage (Mendoza et al.), driven by 2040 future climate scenarios, WFRC travel demand model outputs for on-road emissions projection

Climate and Land Use Change Impacts on Streamflow and Sediment Yield — Jordan River Watershed

Scenario-based hydrological modeling study using HSPF to simulate streamflow and sediment yield in the snowmelt-dominated Jordan River watershed under future climate and LULC change — finding that climate change overwhelms any difference between business-as-usual and smart-growth development patterns as a driver of watershed-scale hydrology.
Region
Jordan River watershed, Salt Lake County, Utah, USA
Ecosystem
Snowmelt-dominated semiarid mountainous watershed; Wasatch Range headwaters draining through a rapidly urbanizing valley to the Great Salt Lake; Great Basin
Sector
Academic
Methods
HSPF v12 (EPA BASINS 4.1) for streamflow and sediment simulation, Dynamical downscaling via WRF at 4 km resolution (RCP 6.0, 2035–2044 and 2085–2094), Statistical downscaling via BCSD from CMIP5 ensemble (231 simulations, 4 RCPs), Change-factor bias correction for dynamically downscaled outputs, BUG LULC scenario: parcel-scale binary logistic regression spatial attraction model, COG LULC scenario: Wasatch Choice for 2040 via Envision Tomorrow+ sketch-planning tool, Parcel-scale impervious cover estimation using per-class EIF lookup (residential: 0.20; commercial/retail/industrial: 0.75), Sensitivity analysis isolating climate vs. LULC change drivers, 50th-percentile timing analysis for streamflow and sediment load

High-Resolution Fossil Fuel CO₂ Emissions Quantification — Salt Lake County (Hestia)

First application of the Hestia bottom-up FFCO₂ framework outside Indianapolis — producing building- and street-segment-scale fossil fuel CO₂ estimates for Salt Lake County across eight sectors at hourly resolution, then using that data product to show that household income, population, building age, and household size explain residential emissions heterogeneity, and that primary versus secondary road type predicts onroad emissions density versus intensity.
Region
Salt Lake County, Utah, USA
Ecosystem
Urbanized intermountain basin; rapidly suburbanizing valley floor, Wasatch Front
Sector
Academic
Methods
Hestia bottom-up FFCO₂ quantification framework (building/street scale, hourly resolution), Salt Lake County Assessor parcel data: building type classification (11 commercial + 4 residential types × 2 vintages), Non-electric energy-use intensity (NE-EUI) from CBECS, RECS, eQUEST building energy model, Vulcan national product as county-total scaling anchor (scaled to 2011 via EIA state fuel statistics), NEI 2011 onroad emissions by road type and vehicle class; spatially allocated via FHWA road network, STIRPAT regression on census block group sociodemographic variables, GIS pipeline: parcel, building, and traffic data processing and spatial disaggregation, Point source emitter location ground-truthing

Jordan River Open Space Inventory — Salt Lake County Conservation Prioritization and Gap Analysis

Parcel-level conservation prioritization and gap analysis for the Jordan River Commission, producing a geodatabase of all Salt Lake County parcels within a 1-mile corridor coded by open-space zoning, conservation easement, and public ownership status — subsequently adopted by three stakeholder organizations for land acquisition planning and regulatory decision-making.
Region
Salt Lake County, Utah, USA
Ecosystem
Urban riparian corridor (Jordan River)
Sector
Regional Government
Methods
1-mile buffer around Jordan River centerline (NHDPlus v2, USGS), Parcel data from UGRC statewide parcel layer, Ownership typology from SLCo Assessor data (reclassified to private/public binary), Conservation easements from National Conservation Easement Database (NCED), Water-related land use from UGRC (State of Utah), Municipal zoning data from 12 SLCo municipal GIS departments, Manual crosswalk of 12 zoning schemas to unified open-space-compatible classification, ArcGIS Desktop 10.3.1

Graph-Theory Habitat Connectivity Modeling — Kansas City Metropolitan Region

Proof-of-concept habitat connectivity analysis for the Mid-America Regional Council using the Kansas City NRI II land cover product, modeling functional patch networks and importance rankings for Western painted turtle and Eastern meadowlark — finding that highway infrastructure has fragmented turtle connectivity in the urbanizing suburban fringe, while meadowlark habitat forms a distinctive ring around the conurbation where total area, not connectivity, is the binding constraint.
Region
Kansas City metropolitan region, Missouri/Kansas, USA
Ecosystem
Tallgrass prairie remnants, freshwater wetlands, urban/suburban fringe, agricultural matrix
Sector
Regional Government
Methods
Kansas City NRI II land cover (2.5m, 2012; multispectral imagery + airborne LiDAR), Species-specific habitat reclassification and raster resampling (10m turtle, 20m meadowlark), Morphological filtering (erode-then-dilate) for patch simplification, Large roadway extraction from impervious surface mask, HUC12 watershed delineation (National Watershed Boundary Dataset), Graphab 1.2: graph-theory connectivity modeling, PC and dPC metrics, Least-cost/resistance path modeling (turtle); Euclidean dispersal (meadowlark), Focal species parameterization from literature review and expert consultation, ArcGIS 10.2 for all spatial processing